The Mann-Whitney test is a powerful test and is unique to situations from which of the choices listed? (Note: There are 2 correct answers).
When a Belt Poka-Yoke’s a defect out of the process entirely then she should track the activity with a robust SPC system on the characteristic of interest in the defect as an early warning system.
“A calculated time frame that matches customer demand” is a definition of what Lean Principles term?
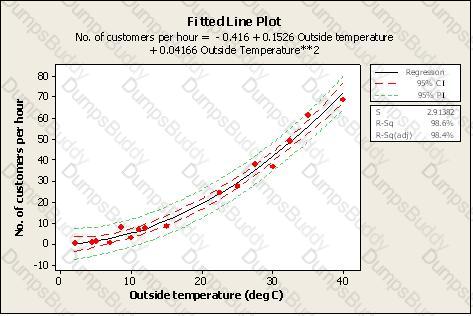
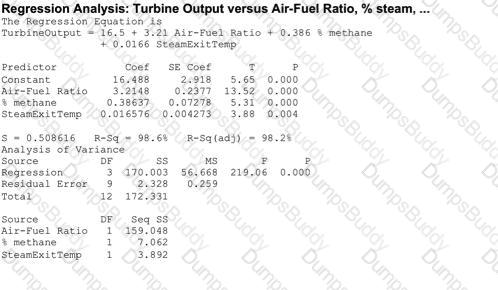
Which statement(s) are correct about the Regression shown here? (Note: There are 2 correct answers).
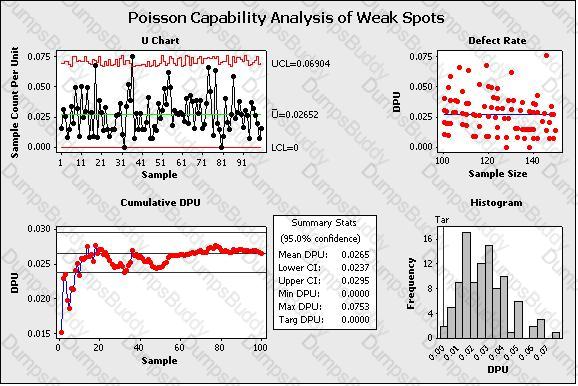
Which statements are correct about the advanced Capability Analysis shown here? (Note: There are 3 correct answers).
Sally and Sara sell flower pots at their garage sale. Sally motivates Sara mentioning that they will sell a minimum of 15 pots per day if the outside temperature exceeds 60o F. From a sample, whose population is assumed to follow a Normal Distribution, taken for 30 days at 60 degrees or more an average of 13.6 pots per day were sold with a Standard Deviation of 0.7 pots. The statistical Degrees of Freedom for this example are?
Fractional Factorial, ____________and Response Surface Method are types of planned experiments.
What dollar amount of savings would a project show if it reduced your outstanding Accounts Receivable by $1.4 million dollars to $5.3 million total and your organization’s marginal cost of capital was 6.2%?
Sally and Sara sell flower pots at their garage sale. Sally motivates Sara mentioning that they will sell a minimum of 15 pots per day if the outside temperature exceeds 60o F. From a sample, whose population is assumed to follow a Normal Distribution, taken for 30 days at 60 degrees or more an average of 13.6 pots per day were sold with a Standard Deviation of 0.7 pots. For the sales accomplished above, what test would validate if they met their requirements?
If the results from a Hypothesis Test are located in the "Region of Doubt" area, what can be concluded?
A Belt rearranged the location of the parts inventory for a rework station locating the most often used parts to be within hand reach of the repair person. This rearrangement resulted in quicker repair times by eliminating one of seven major elements of waste which is the Waste of __________.
Some of the sources for different types of error that can be quantified using Statistical Analysis are ___________________.
Statistical Difference is the magnitude of difference or change required to distinguish between a true difference, brought about by change or improvement, and one that could have occurred by chance.
One of the foundations of Lean Six Sigma is the concept that the output of a process (Y) is influenced by the process inputs (X’s) and is commonly shown as which formula?
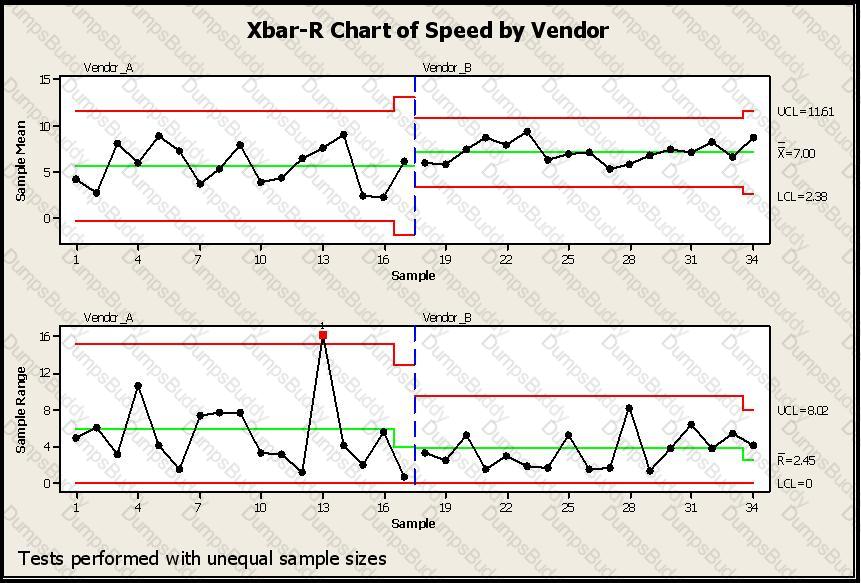
SPC Charts are used extensively in different business and decision-making environments. In this example a vendor is being selected based on speed of delivery. Which of the conclusions would help you pick a vendor for your needs regarding lead-time of delivery from your vendors? (Note: There are 4 correct answers).
A Belt working in a supply chain environment has to make a decision to change suppliers of critical raw materials for a new product upgrade. The purchasing manager is depending on the Belt’s effort requiring that the average cost of an internal critical raw material component be less than or equal to $4,200 in order to stay within budget. Using a sample of 35 first article components, a Mean of the new product upgrade price of $4,060, and a Standard Deviation of $98 was estimated. Select the answer that best states the Practical Problem.
For Attribute Data, Process Capability is defined as the average proportion of nonconforming products.
One of the foundations of Lean Six Sigma is the concept that the output of a process (Y) is influenced by the process inputs (X’s) and is commonly shown as which formula?
Two of the key deliverables for the Measure Phase are a robust description of the process and its flow and an assessment of the Management System.
If you can Poka-Yoke a defect out of the process entirely then you do not need use SPC on the characteristic of interest in the defect.
Sally bought a blender from her local appliance store. When she changed blades the blender would not function. For the manufacturer this would be categorized as what type of cost?
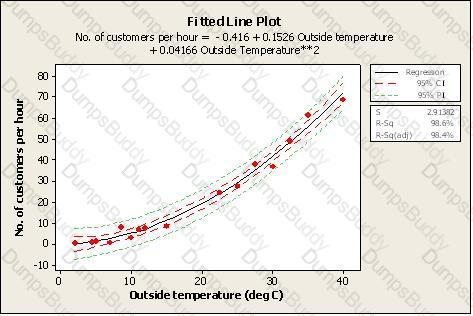
Which statement(s) are correct about the Regression shown here? (Note: There are 2 correct answers).
Following the completion of a LSS project the Belt not only creates a Control Plan he also develops a _____________ so those involved in the process know what to do when the critical metrics move out of spec.
When the Inputs, X’s, for your process are Normally Distributed about the Mean, the Outputs, Y’s, will always be Normally Distributed.
From this list select the items that define what an X-Y Diagram is. (Note: There are 4 correct answers).
To properly analyze the variables impacting the output of a process we need to collect data that represents at least 80% of the variation in the process and assure ourselves we are collecting data from all three types of variation which are _______________.
Cost of Poor Quality (COPQ) can be classified as Visible Costs and Hidden Costs. Which of these items is a Visible Cost?
Since Normality is required if we intend to use the data collected as a predictive tool. To test for Normality of data we must determine if the P-value is ___________.
If a Belt needed to model the data for the number of weaves in section of carpet fabric she would use the _____________ Distribution approach.
Which statement(s) are incorrect for the Regression Analysis shown here? (Note: There are 2 correct answers).
Sally and Sara sell flower pots at their garage sale. Sally motivates Sara mentioning that they will sell a minimum of 22 pots per day if the outside temperature exceeds 60o F. From a sample, whose population is assumed to follow a Normal Distribution, taken for 30 days at 60 degrees or more an average of 18.2 pots per day were sold with a Standard Deviation of 0.9 pots. What is the Z value for this sales process?
Control Charts were developed by Dr. Shewhart to track data over time. To detect Special Cause variation the Control Charts use which of these?
Production Line 1 is able to complete 500 units per shift. Production Line 2 is able to finish 1,500 units per shift. Production Line 2 is 3 times faster than Production Line 1. This analysis is an example of ______________ Scale Data.