CLAD Certified LabVIEW Associate Developer Examination Questions and Answers
You are inputting data that represents a circle. The circle data includes an x position, a y position, and a radius. All three pieces of data are double-precision. In the future, you might need to store the color of the circle, represented as an integer. How should you represent the circle on your front panel window?
How do you document a VI so that the description appears in the Show Context Help popup window?
Which chart update mode plots new data from left to right, then clears the chart and plots the newer data?
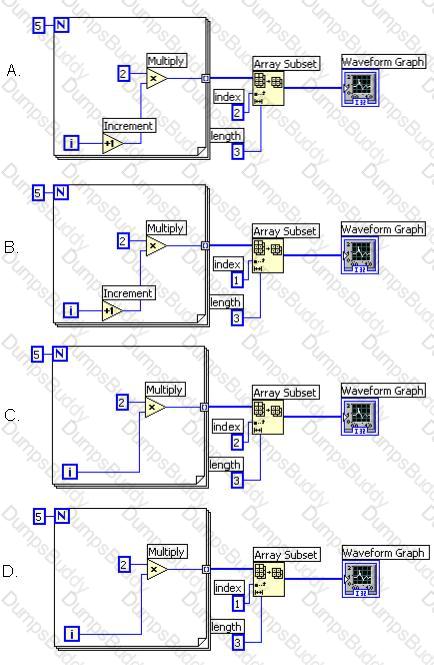
Which of the following Block Diagrams could produce this result in Waveform Graph?


What is the value in Shift Register Answer after the following code has executed?

You can use all of the following data types as inputs to the case selector terminal except:
Which Chart update mode should be used to draw new data from left to right, then clear t he chart and draw new data again from left to right?


